


Text:
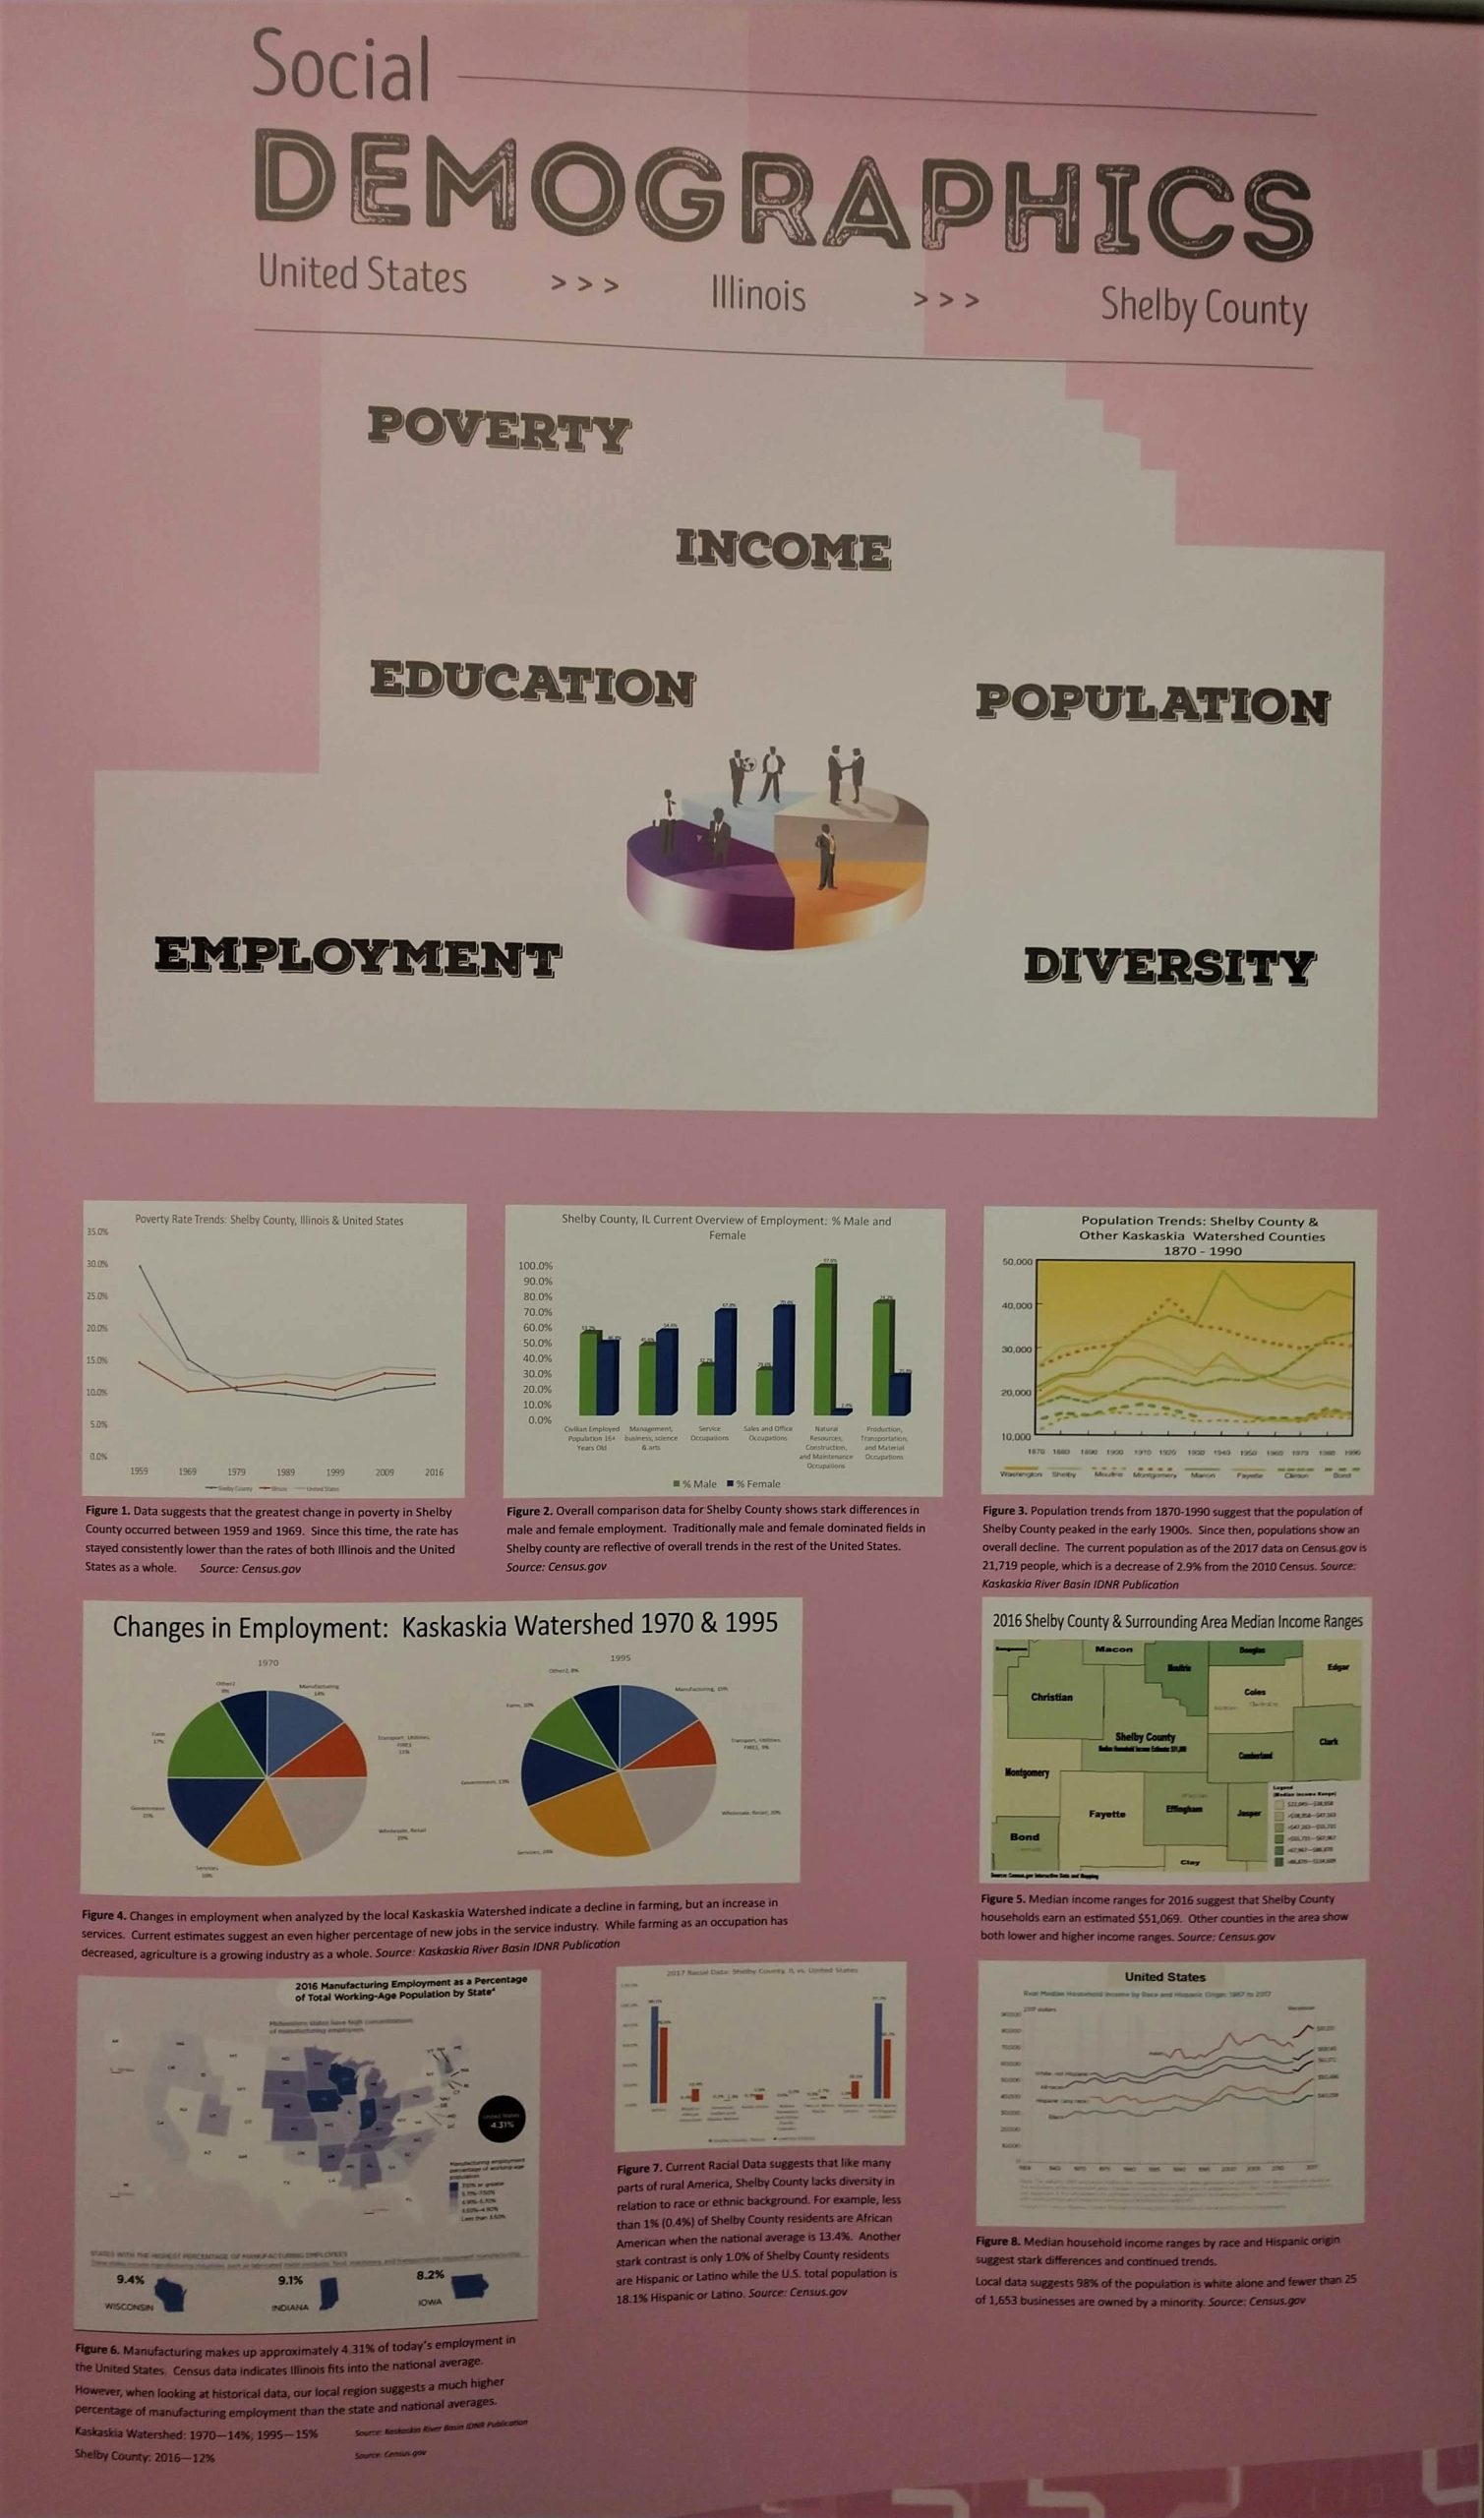
Social DEMOGRAPHICS
United States >>> Illinois >>> Shelby County
- POVERTY
- INCOME
- EDUCATION
- POPULATION
- EMPLOYMENT
- DIVERSITY
Figure 1:
[Graph indicating poverty rate trends in Shelby County and the United States, 1959-2016]
Caption:
Figure 1. Data suggests that the greatest change in poverty in Shelby County occurred between 1959 and 1969. Since this time, the rate has stayed consistently lower than the rates of both Illinois and the United States as a whole. (Source: Census.gov)
Figure 2:
[Graph indicating percentages of male and female Shelby County residents employed in various fields]
Caption:
Figure 2. Overall comparison data for Shelby County shows stark differences in male and female employment. Traditionally male and female dominated fields in Shelby county are reflective of overall trends in the rest of the United States. (Source: Census.gov)
Figure 3:
[Graph indicating population trends in Shelby County and other counties in the Kaskaskia River watershed, 1870-1990]
Caption:
Figure 3. Population trends from 1870-1990 suggest that the population of Shelby County peaked in the early 1900s. Since then, populations show an overall decline. The current population as of the 2017 data on Census.gov is 21,719 people, which is a decrease of 2.9% from the 2010 Census. (Source: Kaskaskia River Basin IDNR Publication)
Figure 4:
[Charts indicating changes in employment in the Kaskaskia River watershed from 1970 to 1995]
Caption:
Figure 4. Changes in employment when analyzed by the local Kaskaskia Watershed indicate a decline in farming, but an increase in services. Current estimates suggest an even higher percentage of new jobs in the service industry. While farming as an occupation has decreased, agriculture is a growing industry as a whole. (Source: Kaskaskia River Basin IDNR Publication)
Figure 5:
[Map indicating median income ranges in Shelby County and other counties nearby, 2016]
Caption:
Figure 5. Median income ranges for 2016 suggest that Shelby County households earn an estimated $51,069. Other counties in the area show both lower and higher income ranges. (Source: Census.gov)
Figure 6:
[Map of the United States indicating percentage of total working-age population employed in manufacturing by state, 2016]
Caption:
Figure 6. Manufacturing makes up approximately 4.31% of today’s employment in the United States. Census data indicates Illinois fits into the national average. However, when looking at historical data, our local region suggests a much higher percentage of manufacturing employment than the state and national averages. Kaskaskia Watershed: 1970—14%, 1995—15% Shelby County: 2016—12%. (Source: Kaskaskia River Basin DNR Publication, Source: Census.gov)
Figure 7:
[Graph indicating racial population data for Shelby County and the United States, 2017]
Caption:
Figure 7. Current Racial Data suggests that like many parts of rural America, Shelby County lacks diversity in relation to race or ethnic background. For example, less than 1% (0.4%) of Shelby County residents are African American when the national average is 13.4%. Another stark contrast is only 1.0% of Shelby County residents are Hispanic or Latino while the U.S. total population is 18.1% Hispanic or Latino. (Source: Census.gov)
Figure 8:
[Graph indicating real median household income by race and Hispanic origin, United States, 1967-2017]
Caption:
Figure 8. Median household income ranges by race and Hispanic origin suggest stark differences and continued trends. Local data suggests 98% of the population is white alone and fewer than 25 of 1,653 businesses are owned by a minority. (Source: Census.gov)
