Section 3: Geo-Tagging Edward P. Jones & Washington, DC
By Kenton Rambsy
ArcGIS Map Created by Ahmed Foggie
Cultural geo-tagging refers to the process of documenting geographic data of a text or group of texts in order to examine place-space dimensions of literature. Readers interested in cultural geo-tagging might raise the following questions:
- Is the story set in a real or fictional location?
- How often and what types of landmarks are mentioned in a given text?
- How are social spaces such as front porches, blues clubs, and corner stores integrated into a story?
- How is language used as a geographic marker?
- What words in the text relate to the actual movements and positioning of characters within the story?
- How do the geographic descriptions relate to other texts set in similar regions?
Asking these types of questions helps researchers determine what types of information to collect when focusing on key settings of a text. My students and I performed close reads and used text mining software to collect specific addresses and routes mentioned by Jones, and we also looked up addresses to landmarks and notable buildings mentioned. We later used this data to create visual aids that help readers envision the actual boundaries of Jones’s fictional settings. These maps and charts facilitate our ability to make broad assessments about 28 stories at once. Visualization software, specifically Tableau Public and ArcGIS, facilitated our ability to organize information related to Jones’s stories and create interactive charts and maps.
Even though geographic locations can be plotted on a map, the coordinates do not necessarily reveal the emotions embedded within a location at a given time and place. Pairing close reads of literary texts with historical analyses of real (and imagined) locations creates new opportunities for interpreting and visualizing literature. By documenting the number and variety of geographical references, including regional settings, landmarks, street names, neighborhoods, and regional dialects, we begin to understand how Black writers mark and plot cultural spaces. We can also interpret the extent to which writers' references to specific geographic locales instill a sense of realism in their works. Ultimately, we can use these observations to offer more nuanced explanations as to how locale impacts characterizations, raced character interactions, and plot development.
This heat map visualizes the frequency of action in Jones’s stories. The brighter the color, the more times this specific location is mentioned in a particular story. Zoom in and out by using the plus and minus symbols. To reset the map view to the original setting, press the home icon.
On the left hand, clicking on a particular story title will reveal information about that particular story. Click on “Lost in the City: All Stories” to get view all of the density of action in all of the stories in that collection. Click on “All Aunt Hagar’s Children: All Stories” to get view all of the density of action in all of the stories in that collection. Click “All Stories” to return to original view.
For years now, I have been trying to utilize cultural geo-tagging as a method to enhance some of my examinations of literature. A dataset of over 400 locations mentioned across Jones’s two collections helps us to better define and visualize the parameters of Jones’s DC. In particular, we can use our records of addresses and landmarks to actually map the settings of his stories and routes taken by his characters. Jones’s use of location-specific words contributes to how readers envision the city and his characters’ various environments by using recognizably Black neighborhoods to assist in constructing his stories’ plots as well as characterization.
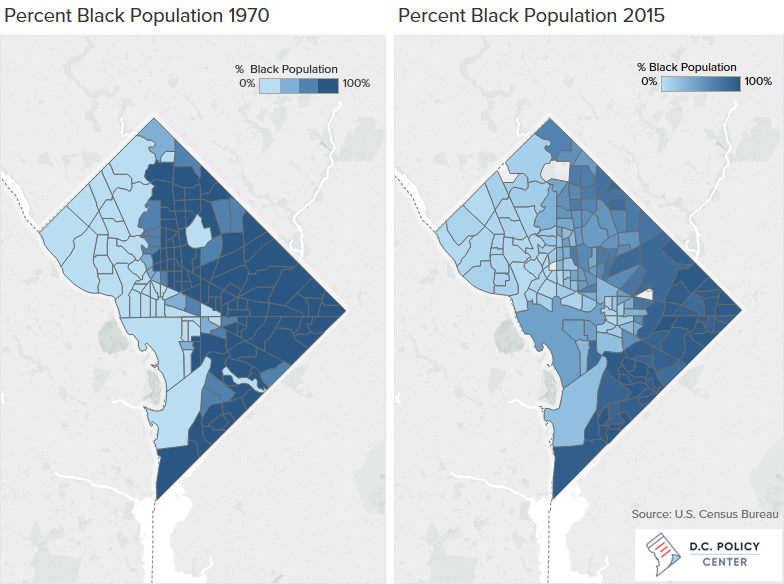
Cultural geo-tagging becomes especially useful when reading information about real-life demographic shifts in DC alongside Jones’s stories. According to David Rusk, DC is no longer “Chocolate City” (slang term for Washington, DC because of its large African American population). In 1970, DC had a majority Black population at 71.1%, with white people making up 27.7% of the District’s population and Hispanic people making up 2.1%. By 2015, the population of DC was 48% Black, 35.6% white, 10.2% Hispanic, 3.6% Asian, and 2.6% mixed race and other races. According to the article, DC now joins New Mexico, California and Texas in not having any one racial group forming a majority of the population. Widespread gentrification has directly contributed to the decline of a Black majority population in the nation’s capital.
Since Jones’s stories are not set in present-day DC, his references to specific landmarks serve as indicators giving insight into the decade of each story. For instance, Jones mentions Kann’s department store in several of his stories. The store has been out of business since 1975, and the eastern Market Square building now stands on the former Kann's site. Jones’s stories act as a cultural reservoir of sorts by incorporating key locations from distinct periods in DC’s geographic history. This type of information helps us to consider the extent to which DC’s landscape has changed over time.
Jones’s DC settings have been the topic of discussion among reviewers who have commented on the significance of the recurring cityscape across the majority of his short stories. Darryl Pinckney explains, “Washington isn’t described in Jones’s stories. It just is: a gathering of nostalgia-producing addresses, locations” (85). In Pinckney’s estimation, Jones's descriptions of DC are not fleshed out, but instead draw on his coming-of-age experiences and recollections of city life. Perhaps Pinckney is suggesting that Jones is so familiar with the DC neighborhoods that he does not feel obligated to go into great detail explaining the significance of each intersection or cross-street in his stories. Jones’s constant references to street names, cultural figures, and landmarks draw on historical and social memories of DC for each character. These memories reveal how a select geographic location has the ability to conjure a range of emotions and thus become significant to Jones’s individual stories and overall collections.
Even though Jones’s stories are fiction, Lost in the City and All Aunt Hagar’s Children give readers a glimpse into the everyday lives of Black characters in settings that for the most part no longer exist. Even though the locations in Jones’s stories can still be pinpointed on a map, people and places have changed over years. Homes and neighborhoods make up the majority of the settings in Jones’s stories. Over the last few decades, however, DC has witnessed a significant decrease in African American residents due to the rising costs in rent brought on by gentrification efforts. Reading Jones’s stories along side the graphs in this collected volume will provide deeper insight into the extent which social and residential spaces for Black DC residents have changed.