Section 2: The Edward P. Jones Dataset
What type of insight can we gain by taking a bird’s eye view of Edward P. Jones’s Lost in the City and All Aunt Hagar’s Children? This question was the driving premise of our graduate seminar as we explored Jones’s two collections composed of 28 short stories and more than 235,000 words. Our approach was similar to the concept of distant reading, explained in the New York Times as “understanding literature not by studying particular texts, but by aggregating and analyzing massive amounts of data.” In this study, however, we did not use a massive amount of data, and we paid special attention to geography.
We used text mining software to identify geographic markers throughout Jones’s stories. We then isolated and exported this and other information from the texts into a spreadsheet. From there, we created an extensive metadata catalog of each of Jones’s stories. The spreadsheet enabled us analyze the data by sorting through a large amount of story information. We were able to document how often certain streets were mentioned and what quadrants most of Jones’s stories were set in, as well as what gender characters he presents most often and how often characters speak.
We uploaded this .csv file, “The Edward P. Jones Dataset,” to the Texas Data Repository. The goal of defining our methodology for this project is to “humanize” the digital. Tanya Clement explains “in ethnographic studies, an articulation of methodology helps the researcher describe a systematic approach to fieldwork and data analysis methods, one that ultimately facilitates a deeper engagement with theory.” We made our dataset available to prompt other scholars to study Jones’s stories with geography in mind.
This dataset reveals patterns within the Washington, DC geography during a time when the city’s demography included a predominantly African American or “Chocolate” citizenry. From walking to driving to taking the bus, the data exposed the familial gravity of community which may have gone unnoticed—at least to this extent—if not for the usefulness of digital methodologies. Eliciting the travel routes and boundaries as well as character demographics from the dataset exemplifies the richness of community in Jones’s DC, perhaps more than any other aspect of the mined text. This dataset not only displayed Jones’s intimate knowledge of DC’s historicity and social inner workings, but also his innovation as a writer. Stylistic information that emerged from the dataset included the writer’s variations of narrative modes—first or third person narration—across the collections and stories. Extracting information about character demographics helps to better contextualize the types of how Jones's populates his fictional environment.
We transformed the dataset into a visual interpretation of Jones’s short stories. These interactive charts map the movement of characters and story settings, provide comparative analyses of the two collections, or provide gendered analyses of characters in each collection. Moreover, these visualizations are far more inviting and useful in presenting our research findings than the densely populated spreadsheets.
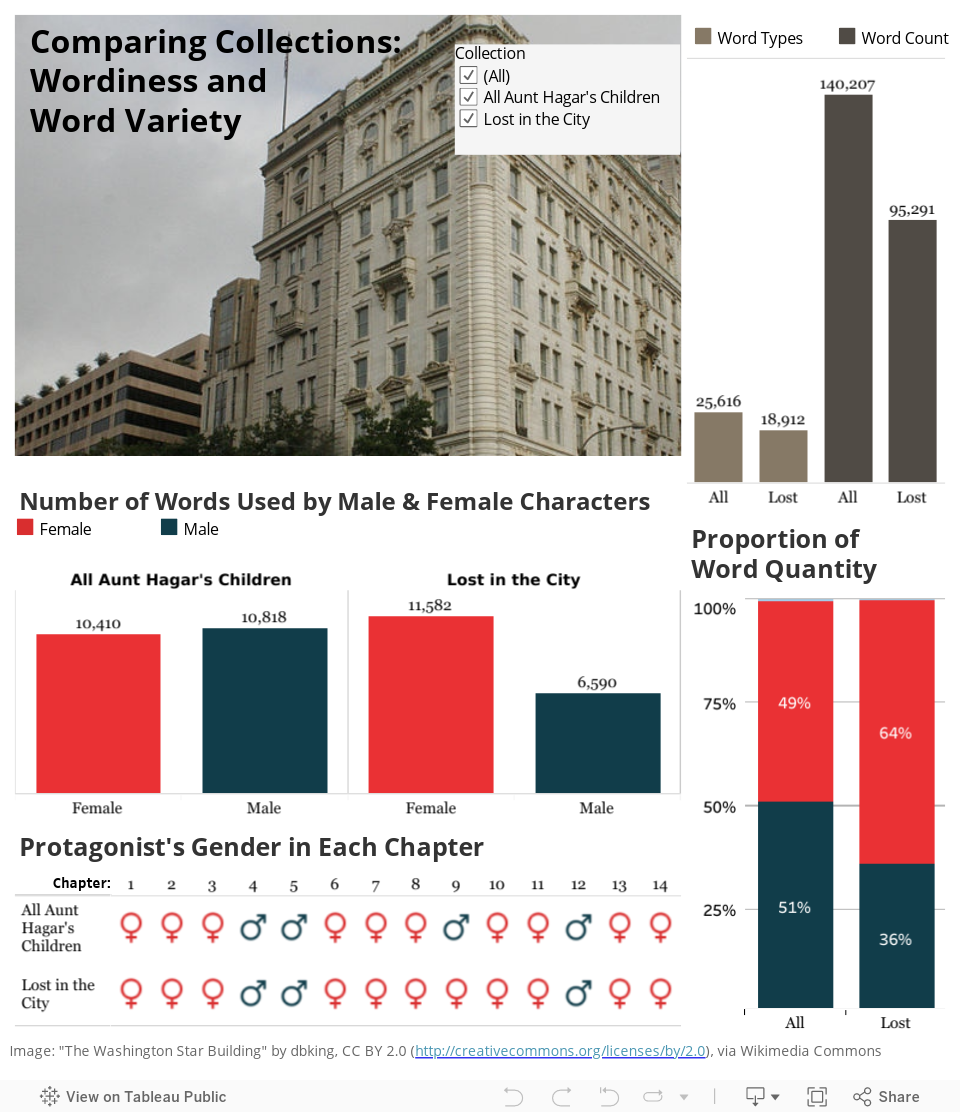
This chart provides a broad overview of Jones’s two collections of short stories, Lost in the City and All Aunt Hagar’s Children. At the top right of the chart, there is a bar graph that compares the total number of words and word types in each collection. Above, in red and blue, is a gender analysis of the characters. The red bars represent the number of words spoken by female characters, and the blue bars represent the number of words spoken by male characters. At the bottom, the red and blue symbols represent the gender of the protagonist in each story.
Hovering over each symbol will reveal the story title and protagonist name. These side-by-side comparisons provide insight into the character dialogue in Jones’s stories.
Distinctions in word counts and word types, as well as estimated time periods, help to construct a type of providential scope of the author’s creative mind. Extracting attribute information of the characters introduces the analytical observer to the community and provides a feel for the author’s preference for certain character types.
Ultimately, we used the data to highlight Jones’s strategic use of landmarks that helped date the period of each story, and tagged the settings of key scenes. Mapping the travel routes and boundaries from the corpus displayed the richness of community in Jones’s DC. From walking to driving to taking the bus, the data exposes the familial gravity of community which may have gone unnoticed—at least to this extent—if not for digital methodologies.
The qualitative analysis shaped by ethnographic study and overlaid onto the digital analysis reveals the social dynamics which confirm the effects of gentrification in DC. Such literary criticism not only applies to localized areas such as Washington, DC, but may also be useful as a gateway to highlighting other signposts of systemic erosions of the collective Black identity embedded in African American literature. Our use of this dataset in our literary analysis helped us identify areas of social concern across a collection of literary texts.