Visualizing Quadrants in Jones's Short Fiction
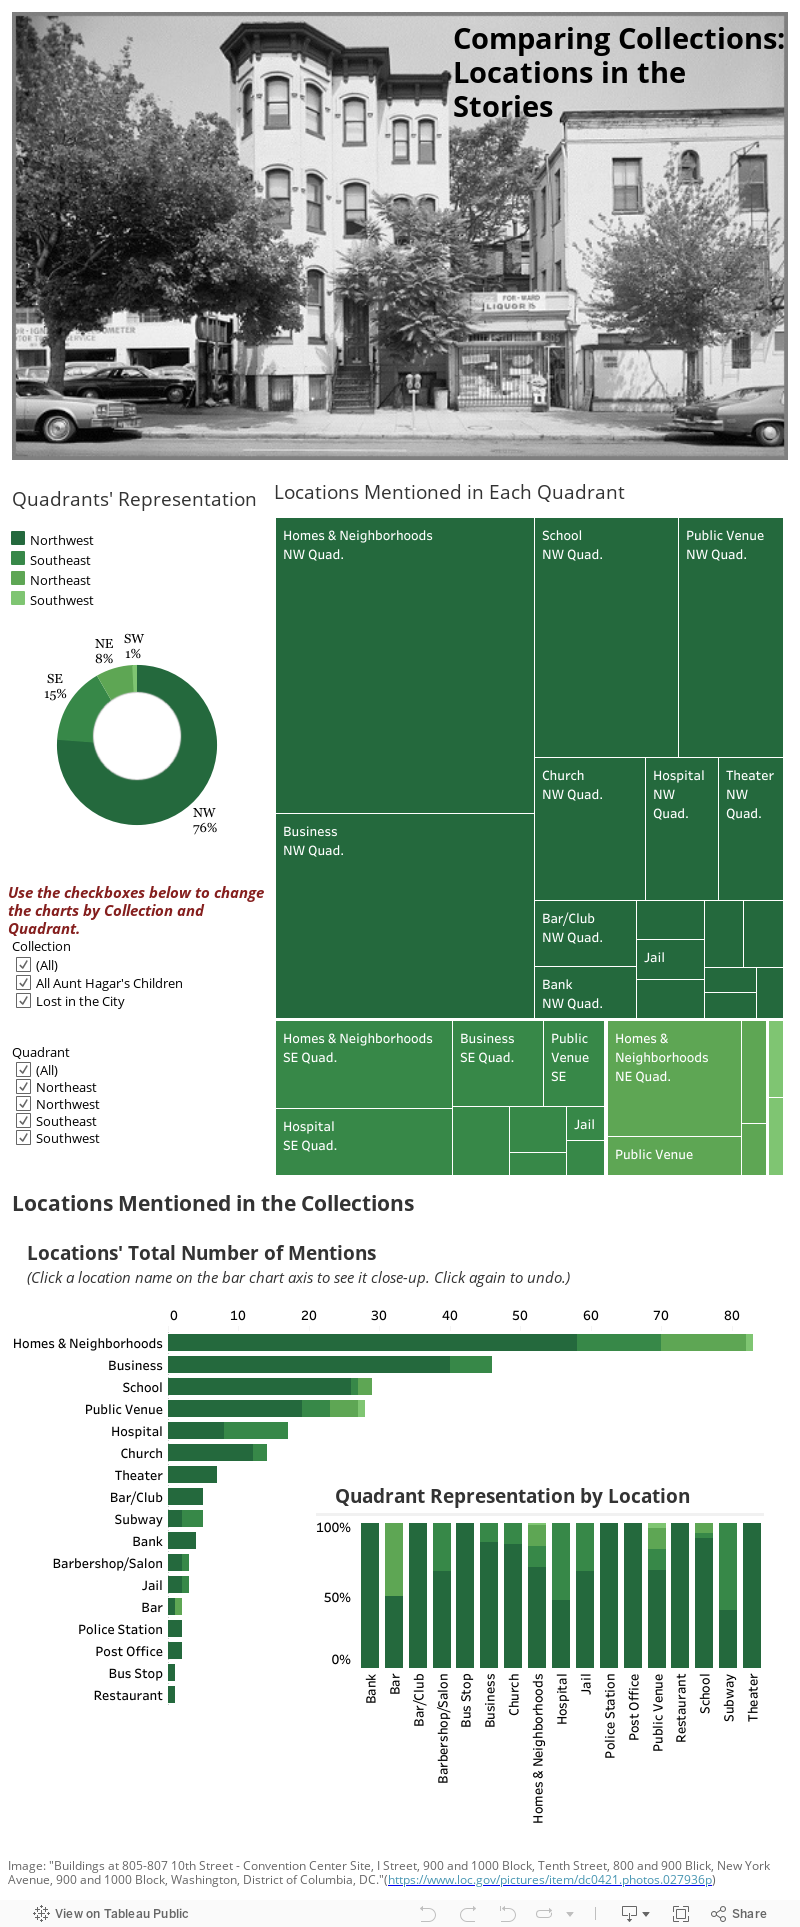
This chart reveals information about place-settings in Jones’s two short story collections totaling 28 stories. The various shades of green represent each of DC’s four quadrants. In the top left corner, the pie chart represents the percentages of times a specific quadrant appears across his two collections of short stories. To the right, the various boxes represent location types ranging from homes and neighborhoods to schools and churches. The larger the box, the more times a particular setting was used in a specific quadrant. Hovering over each box reveals the percentage of times the location was used in that quadrant. The bottom charts offers another visualization of the same information in the form of bar charts. This representation ranks the order of location types Jones features in his collections.