


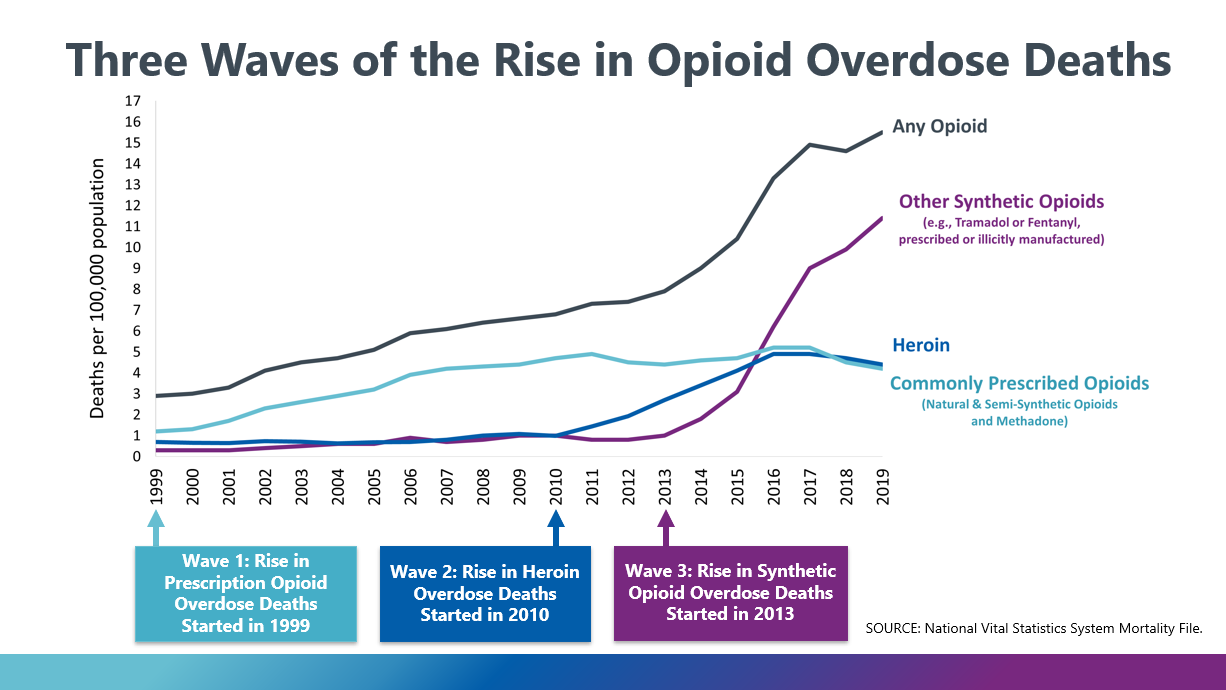
A chart from the CDC (2021) outlining three different waves of opioid overdose deaths tracked from 1999-2019. The first wave indicated by a teal blue line shows the rise in prescription opioid overdose deaths started in 1999, the second wave shows a rise in heroin overdose deaths started in 2010 and the third wave showing a rise in synthetic opioid overdose deaths started in 2013. The drugs tracked are any opioid, other synthetic opioids, heroin, and commonly prescribed opioids.
