


3 Social Determinants of Drug Use, Misuse, and Involvement
Introduction
Why do some people use drugs, while others do not? Why do patterns of drug use for some people escalate to drug misuse? And, further, why do some individuals become involved in the cultivation, manufacture, distribution and sale of illicit drugs, despite knowing these behaviors carry with them increased risk of involvement in the criminal justice system?
While your own behaviors may contribute to drug use and misuse, the decision to use and misuse drugs is now understood to encompass complex behaviors situated within a matrix of ecological interaction occurring at multiple levels. Individuated treatment approaches centered on individual behavior via health beliefs, self-efficacy, or reasoned action (Rhodes, 2002) are ill equipped to address the generative interactivity across the biological, familial, sociocultural, economic, and physical environments (Thomas, 2007). These social-ecological factors are comprised of determinants that, as we will see throughout this module, disproportionately influence drug-related harms to particular groups of people and communities (World Health Organization, 2010).
Learning Objectives
- Develop familiarity with demographic trends of licit and illicit drug use and misuse.
- Understand the difference between risk factors and protective factors.
- Identify social determinants of health.
- Explain the social and economic impacts of the War on Drugs.
- Demonstrate comprehension of how social and community factors influence disproportionate levels of drug-related harms for specific groups of people.
Image 3.1 – Two Women Smoking Cigarettes

Learning Content
Use and Misuse of Illicit Drugs, Alcohol, and Tobacco: Demographic Trends
As we begin to discuss in detail the social determinants of drug use, misuse, and involvement (e.g., cultivation, manufacture, distribution and sale of illicit drugs), it is important to have a clear sense of the broad demographic patterns of use and misuse of licit and illicit drugs in America.
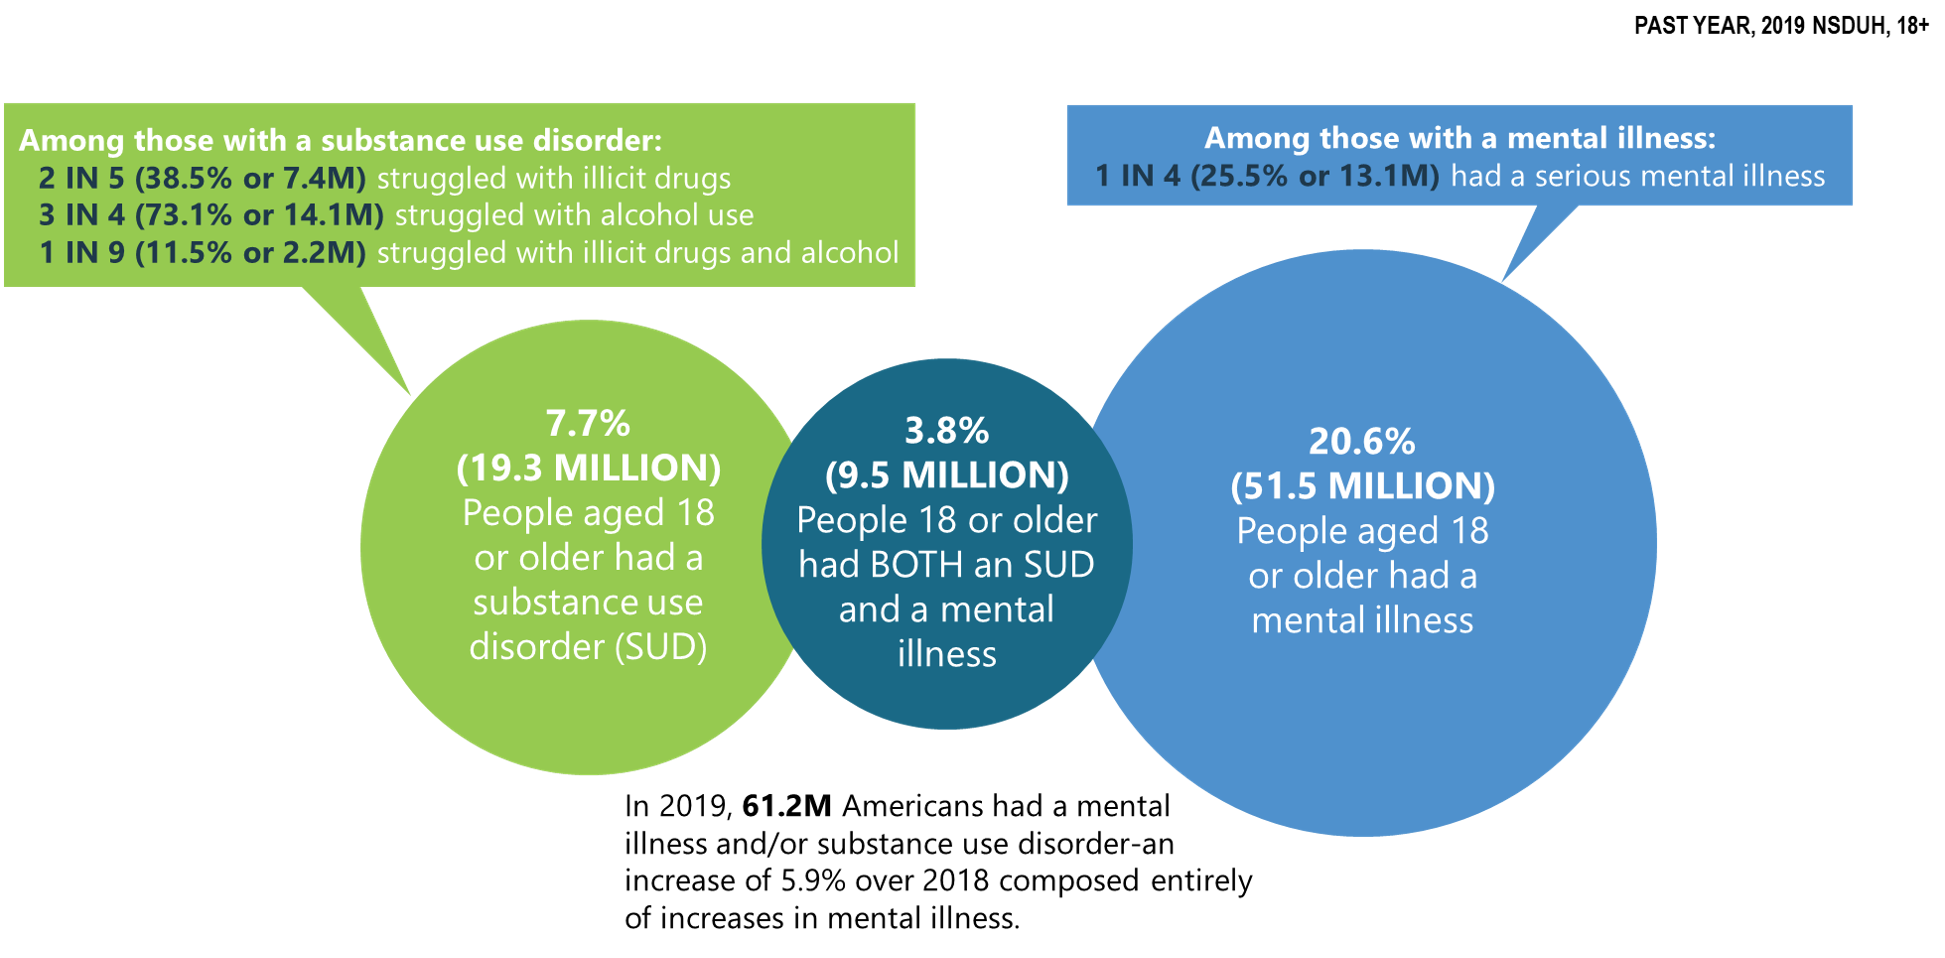
Mental Illness and Substance Use Disorders in the U.S.
Chart 3.1 – Chart from The National Survey on Drug Use and Health: 2019
Education
Educational attainment is not generally a reliable predictor of illicit drug use among adults aged 26 or older within the past year. This is demonstrated by the fact that adults who have graduated from college generally have lower rates of illicit drug use (17.4%) than those who have some college experience or an associate’s degree (21.2%), whereas, oddly, both of these “college experience/graduation” groups have higher rates of illicit drug use than adults whose highest level of educational attainment is high school graduate (17.2%) or less than high school (16.3%).
Notably though, with-in group rates, i.e. rates within the same group, of illicit drug use for 3 out of 4 of these educational attainment groups showed statistically significant increases from 2018 to 2019. In that timeframe, illicit drug use increased for adults who did not graduate from high school (13.8% to 16.3%), high school graduates (15.5% to 17.2%), and adults with some college or an associate’s degree (19.6% to 21.2%); whereas the change among college graduates was not statistically significant (Center for Behavioral Health Statistics and Quality, 2020). What this tells us is that although graduating from college does not appear to impact whether or not you will use illicit drugs versus a person with less education, the rates of illicit drug use among college graduates is relatively stable, whereas it seems to be increasing for those with less educational experience.
Adolescents
Chart 3.2 – Alcohol or Illicit Drug Use Among Adolescents in the Past 30 Days in 2017
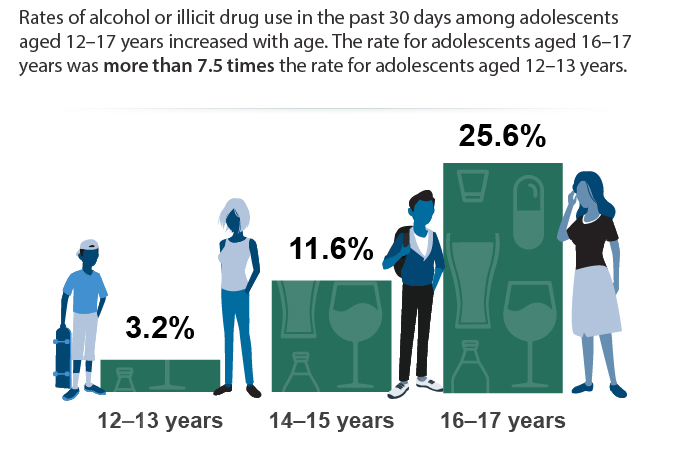
Critical Thinking
Why do you think there are such sharp increases in the rates of alcohol and illicit drug use in later adolescence?
College-Aged Adults
Findings from a 2019 national survey on drug use among college-age adults administered by the Institute on Social Research revealed:
- Cigarette smoking continued a downward trend, with 7.9% of college students reporting having smoked in the past month. Among their peers who are not in college, 16% reported having smoked in the past month, an all-time low.
- Binge drinking (five or more drinks in a row in the past two weeks), which has been declining gradually over the past few decades, showed no significant changes for young adults attending or not attending college. In 2019, 33% of college students and 22% of same-age adults not in college reported binge drinking. High-intensity drinking (10 or more drinks in a row in the past two weeks) has stayed level at about 11% since 2015 for people between the ages of 19 and 22, regardless of college attendance.
- Prescription opioid misuse continued to decline, with 1.5% of college students and 3.3% of those not attending college reporting non-medical use of opioids (narcotic drugs other than heroin) in the past year. This represents a significant five-year decline from rates of 4.8% and 7.7%, respectively, in 2014.
- Amphetamine use continued to decline, with 8.1% of college students and 5.9% of non-college respondents reporting non-medical use of amphetamines in the past year.
- While cigarette use is down, vaping both nicotine and marijuana is increasing among college aged students regardless of whether they are enrolled in college.
Overall, for college-aged adults many drug and alcohol use and misuse categories continue to show downward trends (e.g. cigarette smoking, prescription opioid misuse, amphetamine use), while others remain unchanged (e.g. binge drinking) or are increasing (e.g. vaping both nicotine and marijuana).
Further, there are no clear relationship patterns regarding whether or not college attendance for college-aged adults impacted drug and alcohol use and misuse. In some cases, such as cigarette smoking and prescription opioid misuse, college-aged adults not enrolled in college reported rates of use 2 times higher (16% smoking; 3.3% opioid misuse) than their college-enrolled counterparts (7.9% smoking; 1.5% opioid misuse). In the opposite direction, rates of binge drinking and amphetamine use were higher for college-aged adults enrolled in college (33% binge drinking; 8.1% amphetamine use) when compared with those not enrolled in college (22% binge drinking; 5.9% amphetamine use). (Schulenberg, J. E. et al., 2020).
Employment
Employment status affects current illicit drug use, with unemployed adults reporting the highest rates of use.
Among adults aged 26 and older, the rates of illicit drug use within the past year for those who were unemployed (30.3%) were 47.1% higher than those working full time (20.6%), 62% higher than those with part-time (18.7%) employment, and more than twice the rates of those whose employment status was “other” (13.9%), which includes students, persons keeping house or caring for children full time, retired or disabled persons, or other persons not in the labor force.
These data show important findings that those who are unemployed use illicit drugs at much higher rates than all other levels of employment. The severity of the negative impacts of unemployment on illicit drug use, however, becomes much clearer when examining the role of unemployment as a factor for an illicit substance use disorder (substance use disorder involving an illicit drug). When compared with all other levels of employment status, adults 26 or older who are currently unemployed report rates of illicit substance use disorder (9.1%) at more than four times the rate of all other employment levels: full-time (2.1%), part-time (2.1%), or “other” (1.9%) (Center for Behavioral Health Statistics and Quality, 2020).
Generally, unemployment tends to increase the likelihood of illicit drug use and misuse.
Poverty
As we examine the rates of illicit drug use stratified by poverty, it is important to first understand the poverty thresholds for a specific household size within a particular year, as the poverty threshold increases or decreases depending upon household size and can change year to year with inflation.
The poverty threshold for a household of 4 in 2019 was equal to a total annual household income of $25,750.00. Poverty threshold levels for statistical indices in 2019 were:
- less than 100% if the total annual household income for a household of 4 is below $25,750,
- 100-199% if the total annual household income for a household of 4 is between $25,750.00 and $51,242.50, and
- 200% or more if the total annual household income for a household of 4 is more than $51,500.
Rates of illicit drug use and illicit drug use disorder tracked against poverty thresholds for adults aged 18 or over show a gradient pattern of use and dependence with the highest rates associated with the poorest adults, whereafter the rates decline as poverty decreases (or total annual household income increases). Adults 18 or over living in households at less than 100% of the poverty threshold report rates of illicit drug use in the past year (27.2%) at levels nearly 20% higher than those at 100-199% of the poverty threshold (22.9%), and 40.2% higher than their most affluent peers (2.4% in the 200% or more category).
As observed when fielding patterns of illicit drug use and dependence related to unemployment, increased drug use can lead to increased dependence. This is also the case regarding poverty where the poverty level (less than 100%) reporting the highest use also reported the highest rates of illicit drug-use disorder. In other words, just as drug use and misuse was the highest for those who were unemployed, similarly, it is the highest for those who suffer from poverty. Among adults aged 18 or over, persons living in households at less than 100% of the poverty threshold reported illicit substance use disorder (5.3%) at rates 60.6% more than those at 100-199% of the poverty threshold (3.3%), and more than twice their more affluent peers at 200% or more of the poverty threshold (2.4%). (U.S. Department of Health and Human Services, 2019; Center for Behavioral Health Statistics and Quality; 2020).
Criminal Justice System Involvement
Criminal justice system involvement is also strongly correlated with use and misuse of illicit drugs and alcohol. Adults aged 18 or older who were placed on parole or other supervised release from prison in the past year report using illicit drugs in the past month at more than 2.5 times the rate of individuals who are not on parole or supervised release from prison (30.8% versus 13.3%, respectively). When considering the use of more severe illicit drugs (excluding marijuana from the illicit drug category), this difference (16.7% parole/supervised release) increases to nearly fivefold that of individuals not on parole or supervised release from prison (3.4%). Following these trends, rates of heavy alcohol use for those who are on parole or other supervised release from prison in the past year (12.6%) are twice that of adults who are not on parole or supervised release from prison (6.3%). (Center for Behavioral Health Statistics and Quality, 2020)
Critical Thinking
Take a moment to consider the important takeaways from these demographic trends; then, respond thoughtfully to the following questions:
What demographic categories are associated with the highest rates of use and misuse? Are there any discernible patterns in these data? What findings surprised you?
Risk and Protective Factors For Drug Use and Misuse
Image 3.2 – Graffiti Art: Risk?
The below information, until Table 3.1, is verbatim derived from Substance Abuse and Mental Health Services Administration, Risk and protective factors. [Fact Sheet] (2019).
Assessing the risk and protective factors that contribute to substance use disorders helps practitioners select appropriate interventions.
Many factors influence a person’s chance of developing a mental and/or substance use disorder. Effective prevention focuses on reducing those risk factors, and strengthening protective factors that are most closely related to the problem being addressed.
Risk factors are characteristics at the biological, psychological, family, community, or cultural level that precede and are associated with a higher likelihood of negative outcomes.
Protective factors are characteristics associated with a lower likelihood of negative outcomes or that reduce a risk factor’s impact. Protective factors may be seen as positive countering events.
Some risk and protective factors are fixed: they don’t change over time. Other risk and protective factors are considered variable and can change over time. Variable risk factors include income level, peer group, adverse childhood experiences (ACEs), and employment status.
Individual-level risk factors may include a person’s genetic predisposition to addiction or exposure to alcohol prenatally.
Individual-level protective factors might include positive self-image, self-control, or social competence.
Image 3.3 – Bulletin Board with Terms Related to Drug Misuse

Key Features of Risk and Protective Factors
Prevention professionals should consider these key features of risk and protective factors when designing and evaluating prevention interventions. Then, prioritize the risk and protective factors that most impact the community. Additionally, prevention professionals should recognize that risk and protective factors exist in multiple contexts.
All people have biological and psychological characteristics that make them vulnerable to, or resilient in the face of, potential behavioral health issues. Because people have relationships within their communities and larger society, each person’s biological and psychological characteristics exist in multiple contexts. A variety of risk and protective factors operate within each of these contexts. These factors also influence one another.
Targeting only one context when addressing a person’s risk or protective factors is unlikely to be successful, because people don’t exist in isolation. For example:
- In relationships, risk factors include parents who use drugs and alcohol or who suffer from mental illness; child abuse and maltreatment; and inadequate supervision. In this context, parental involvement is an example of a protective factor.
- In communities, risk factors include neighborhood poverty and violence. Here, protective factors could include the availability of faith-based resources and after-school activities.
- In society, risk factors can include norms and laws favorable to substance use, as well as racism and a lack of economic opportunity. Protective factors in this context would include hate crime laws or policies limiting the availability of alcohol.
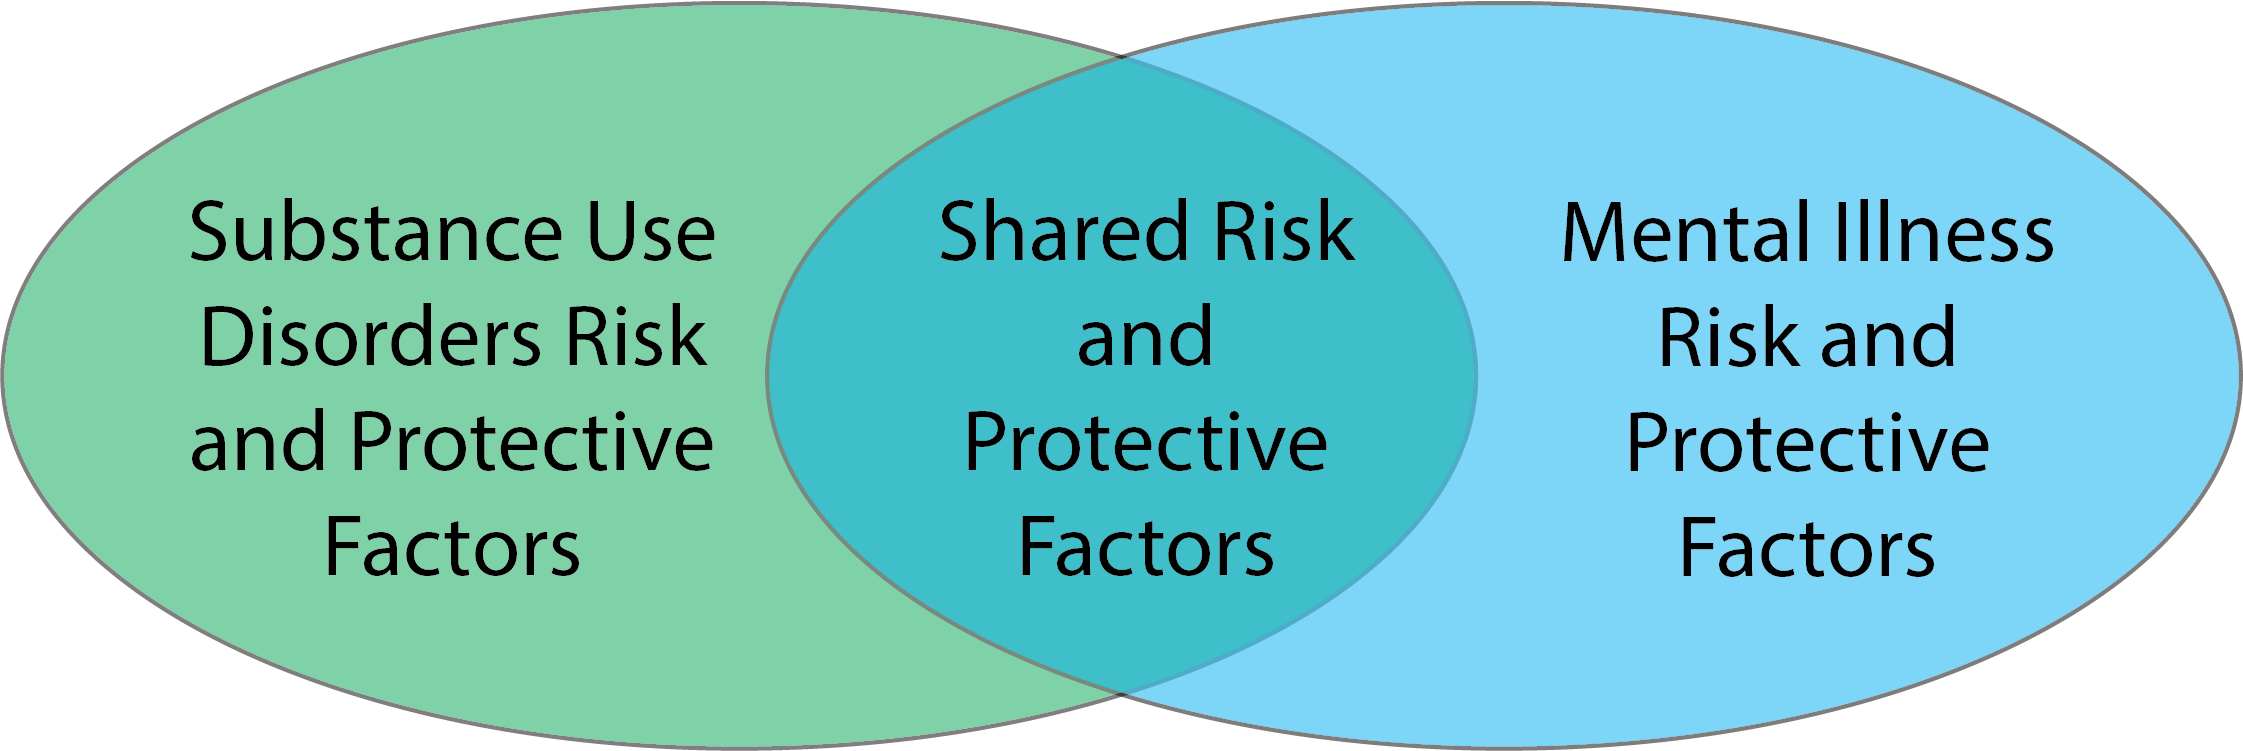
Chart 3.3 – Risk and Protective Factors
Prevention professionals should recognize that risk and protective factors are correlated and cumulative. Risk factors tend to be positively correlated with one another and negatively correlated to protective factors. In other words, people with some risk factors have a greater chance of experiencing even more risk factors, and they are less likely to have protective factors.
Risk and protective factors also tend to have a cumulative effect on the development—or reduced development—of behavioral health issues. Young people with multiple risk factors have a greater likelihood of developing a condition that impacts their physical or mental health; young people with multiple protective factors are at a reduced risk.
These correlations underscore the importance of:
- early intervention
- interventions that target multiple, not single, factors
Prevention professionals should recognize that individual factors can be associated with multiple outcomes. Though preventive interventions are often designed to produce a single outcome, both risk and protective factors can be associated with multiple outcomes. For example, negative life events are associated with substance use as well as anxiety, depression, and other behavioral health issues. Prevention efforts targeting a set of risk or protective factors have the potential to produce positive effects in multiple areas.
Risk and protective factors can have influence throughout a person’s entire lifespan. For example, risk factors such as poverty and family dysfunction can contribute to the development of mental and/or substance use disorders later in life. Risk and protective factors within one particular context—such as the family—may also influence or be influenced by factors in another context. Effective parenting has been shown to mediate the effects of multiple risk factors, including poverty, divorce, parental bereavement, and parental mental illness. The more we understand how risk and protective factors interact, the better prepared we will be to develop appropriate interventions. (Substance Abuse and Mental Health Services Administration Risk, and Protective Factors. [factsheet], 2019).
The table below describes how risk and protective factors affect people in five domains, or settings, where interventions can take place (National Institute on Drug Abuse, What are risk factors and protective factors?, 2020; U. S. Dept. of Health and Human Services, Preventing Drug Use Among Children and Adolescents, 2003).
Table 3.1 – Risk, Domain, and Protective Factors
| Risk Factors | Domain | Protective Factors |
|---|---|---|
| Early Aggressive Behavior | Individual | Self-Control |
| Lack of Parental Supervision | Family | Parental Monitoring |
| Substance Abuse | Peer | Academic Competence |
| Drug Availability | School | Anti-drug Use Policies |
| Poverty | Community | Strong Neighborhood Attachment |
Impact of Socioeconomic Status on Health & Health Behavior
Image 3.4 – Old Apartment Complex
Building upon the demographic data discussed earlier in this module, this section defines socioeconomic status (SES) and describes how the components of SES (e.g., education, income, employment) act as social determinants influencing individual and community-level health and behavior, and, more specifically, how SES intersects with racial-ethnic minority status.
Review this factsheet from the American Psychological Association to learn more about Socioeconomic Status & Ethnic and Racial Minorities (American Psychological Association, Ethnic and Racial Minorities & Socioeconomic Status. [factsheet], 2017).
What are the social determinants of health? Health is influenced by many factors, which may generally be organized into five broad categories known as determinants of health: genetics, behavior, environmental and physical influences, medical care and social factors. These five categories are interconnected.
The fifth category (social factors as a determinant of health) encompasses economic and social conditions that influence the health of people and communities (Commission on Social Determinants of Health, 2008). These conditions are shaped by socioeconomic position, which is the amount of money, power, and resources that people have, all of which are influenced by socioeconomic and political factors (e.g., policies, culture, and societal values) (Commission on Social Determinants of Health, 2007). An individual’s socioeconomic position can be shaped by various factors such as their education, occupation, or income. All of these factors (social determinants) impact the health and well-being of people and the communities they interact with.
Several factors related to health outcomes are listed below:
- early childhood development
- quality of education
- ability to get and hold a job
- type of work a person is engaged in
- food security
- access to health services
- living conditions such as housing status, public safety, clean water and pollution
- individual and household income
- social norms and attitudes (discrimination, racism and distrust of government)
- residential segregation (physical separation of races/ethnicities into different neighborhoods)
- social support
- language and literacy
- incarceration
- culture (general customs and beliefs of a particular group of people)
- access to mass media and emerging technologies (cell phones, internet, and social media)
All of these factors are influenced by social circumstances. Of course, many of the factors in this list are also influenced by the other four determinants of health.
Addressing social determinants of health is a primary approach to achieving health equity. Health equity can be defined in several ways. One commonly used definition of health equity is an environment in which all people have “the opportunity to ‘attain their full health potential’ and no one is ‘disadvantaged from achieving this potential because of their social position or other socially determined circumstance’” (Braveman, 2003). Health equity has also been defined as “the absence of systematic disparities in health between and within social groups that have different levels of underlying social advantages or disadvantages—that is, different positions in a social hierarchy” (Braveman & Gruskin, 2003). Achieving health equity requires valuing everyone equally with focused and ongoing societal efforts to address avoidable inequalities, historical and contemporary injustices, and the elimination of health and healthcare disparities.
Social determinants of health such as poverty, unequal access to health care, lack of education, neighborhood disadvantage, stigma, and racism contribute to broad structural health inequities that shape risky behavior patterns including increased prevalence of drug use and dependence as well as participation in the cultivation, manufacture, distribution and sale of illicit drugs.
In addition to clinical approaches and interventions aimed at modifying behavior, where appropriate, a growing body of research highlights the importance of upstream factors that influence health and the need for policy interventions to address those factors (Gnadinger, 2014). Health organizations, research institutes, governmental agencies, and education programs are encouraged to look beyond behavioral factors and address underlying systemic factors related to social determinants of health (Centers for Disease Control, Adapted from: What is health equity?, 2019).
Check Your Knowledge
The War on Drugs
Image 3.5 – Man in Jail Cell

True Stories: Read an excerpt from Michelle Alexander’s New York Times best-selling book, The New Jim Crow: Mass Incarceration in the Age of Colorblindness, as she shares the story of Erma Faye Stewart, a mother of two children, who was caught up in a drug sweep in Hearne, Texas.
Imagine you are Erma Faye Stewart, a thirty-year-old, single African American mother of two who was arrested as part of a drug sweep in Hearne, Texas (Frontline, 2004; Davis, 2007). All but one of the people arrested were African American. You are innocent. After a week in jail, you have no one to care for your two small children and are eager to get home. Your court-appointed attorney urges you to plead guilty to a drug distribution charge, saying the prosecutor has offered probation. You refuse, steadfastly proclaiming your innocence. Finally, after almost a month in jail, you decide to plead guilty so you can return home to your children. Unwilling to risk a trial and years of imprisonment, you are sentenced to 10 years’ probation and ordered to pay $1,000 in fines, as well as court and probation costs. You are also now branded a drug felon. You are no longer eligible for food stamps; you may be discriminated against in employment; you cannot vote for at least 12 years, and you are about to be evicted from public housing. Once homeless, your children will be taken from you and put in foster care.
A judge eventually dismisses all cases against the defendants who did not plead guilty. At trial, the judge finds that the entire sweep was based on the testimony of a single informant who lied to the prosecution. You, however, are still branded a drug felon, homeless, and desperate to regain custody of your children. Now place yourself in the shoes of Clifford Runoalds, another African American victim of the Hearne drug bust (American Civil Liberties Union, 2002). You returned home to Bryan, Texas, to attend the funeral of your 18-month-old daughter. Before the funeral services begin, the police show up and handcuff you. You beg the officers to let you take one last look at your daughter before she is buried. The police refuse. You are told by prosecutors that you are needed to testify against one of the defendants in a recent drug bust. You deny witnessing any drug transaction; you don’t know what they are talking about. Because of your refusal to cooperate, you are indicted on felony charges. After a month of being held in jail, the charges against you are dropped. You are technically free, but as a result of your arrest and period of incarceration, you lose your job, your apartment, your furniture, and your car. Not to mention the chance to say good-bye to your baby girl.
This is the War on Drugs. The brutal stories described above are not isolated incidents, nor are the racial identities of Erma Faye Stewart and Clifford Runoalds random or accidental. In every state across our nation, African Americans—particularly in the poorest neighborhoods—are subjected to tactics and practices that would result in public outrage and scandal if committed in middle-class white neighborhoods. In the drug war, the enemy is racially defined. The law enforcement methods described [earlier] have been employed almost exclusively in poor communities of color, resulting in jaw-dropping numbers of African Americans and Latinos filling our nation’s prisons and jails every year. We are told by drug warriors that the enemy in this war is a thing—drugs—not a group of people, but the facts prove otherwise (Alexander, M., 2010).
View the press conference on June 18, 1971, from the East Room of the White House, where President Richard Nixon launched the “War on Drugs.”
Video 3.1 – President Nixon Declares Drug Abuse “Public Enemy Number One”
With the identification of drug misuse as “Public Enemy No. 1,” President Richard Nixon launched the War on Drugs. Though the initial policies included significant resource allocation for substance misuse prevention and treatment programs aimed at “prevention of new addicts, and the rehabilitation of those who are addicted” (The American Presidency Project: Special Message to the Congress in 1971), what followed over the next 40 years was an unprecedented wave of punitive drug policies with increasing incarceration of U.S. citizens for drug related crimes. As of 2017, the U.S. was incarcerating its citizens at 5 to 10 times the rate of other industrialized nations (The Sentencing Project, 2019).
Chart 3.4 – International Rates of Incarceration per 100,000 in 2019
Anti-Drug Abuse Act of 1986
The above graph shows current incarceration rates across the world per 100,000 people. The U.S. incarceration rate is 639 per 100,000 people followed by El Salvador at 572 per 100,000 people. Incarceration rates in the U.S. were not always this high. Prison and jail populations across the country began to escalate sharply in the 1980s with the passage of the Anti-Drug Abuse Act of 1986 under President Ronald Reagan. Passing with strong bipartisan support, the Anti-Drug Abuse Act ushered in harsher penalties, mandatory minimum sentencing for some drug crimes (e.g. those involving crack cocaine), and increased enforcement activities, in particular for low-level drug offenses, by raising overall spending thresholds on drug enforcement by $1.7 billion (Pearl, 2018; Teasley, 2001). Along with the mandatory minimum sentences was a 100:1 sentencing disparity for crack versus powder cocaine. Note that crack was used mainly by the Black community and powder cocaine by Whites. Under this provision of the law, possession of 5 grams of crack cocaine received the same sentence as possession of 500 grams of powder cocaine. The impacts of the Anti-Drug Abuse Act of 1986 were disproportionately levied against low-income, ethnic minority communities nationwide. (Note: In 2010, 24 years after the passage of the Anti-Drug Abuse Act of 1986, Congress passed the Fair Sentencing Act during the Obama Administration reducing the crack versus powder cocaine sentencing disparity from 100:1 to 18:1.)
Violent Crime Control Act and Law Enforcement Act of 1994
The second piece of major legislation introduced during the War on Drugs was the Violent Crime Control Act and Law Enforcement Act of 1994. The 1994 Crime Bill, as it is better known, was passed during the Clinton Administration. Similar to the Anti-Drug Abuse Act of 1986, it received strong bipartisan support. From 1980 to 1992, when urban areas across the nation faced a 27% increase in violent crime rates and overall crime fell just 5% (Block & Twist, 1994), being “tough-on-crime” was viewed by many politicians as an effective strategy to both secure the economic vitality of American cities and protract their own political longevity.
- increased enforcement activities training 100,000 new police officers to patrol American streets as part of an enhanced community policing program that disproportionately centered on marginalized racial-ethnic minority communities;
- large grant mechanisms totaling $9.7 billion to fund new prison construction;
- authorizing the death penalty for 60 new federal offenses;
- making juveniles aged 13 and older eligible to be prosecuted as adults for certain serious violent crimes; and
- expanded mandatory minimum sentencing provisions (“3 Strikes and You Are Out!”) including mandatory life imprisonment without possibility of parole for federal offenders with three or more convictions for serious violent felonies or drug trafficking crimes (U. S. Department of Justice, 1994).
The ramifications of these two major policies enacted during the height of the War on Drugs (Anti-Drug Abuse Act of 1986; 1994 Crime Bill) has shaped the carceral system and low-income minority communities in the U.S. as we know them today. Largely as a result of these policies, marginalized racial-ethnic minority communities in the U.S. are more fragmented than ever before with a new prison opened every 10 days from 1990 to 2005 (Kirchhoff, 2010) and in 2015 approximate 77% of people serving time in federal prisons and about 57% of people in state prison for drug convictions are Black or Latino (Drug Policy Alliance, 2015). Further, when considering the fraying of the nuclear family, 1 in 9 Black children has an incarcerated parent, compared to 1 in 28 Latino children and 1 in 57 white children; totaling 2.7 million children growing up in U.S. households in which one or two parents are incarcerated, where two-thirds of these parents have been convicted of nonviolent offenses (Western & Pettit, 2010).
Collateral Consequence Laws & the Social Costs of a Felony Drug Conviction
In addition to serving time in prison, individuals in the U.S. convicted of felony drug offenses are subject to collateral consequence laws that limit their participation across multiple sectors of mainstream society.
Collateral consequences are defined as “legal and regulatory restrictions that limit or prohibit people convicted of crimes from accessing employment, business and occupational licensing, housing, voting, education, and other rights, benefits, and opportunities” (National Inventory of Collateral Consequences of Conviction, 2021).
Examples of collateral consequences are listed below:
- stigma of being a drug felon
- ineligibility for government sponsored supplemental nutrition assistance programs (SNAP)
- ineligibility for government sponsored student loan programs
- ineligibility for government sponsored housing assistance programs
- cannot live with individuals who receive housing assistance from government programs (even if they are family members)
- ineligibility to vote (varies by state)
- potential employers can legally discriminate in hiring processes due to felony conviction
True or False
Video 3.2 – What is the Drug War? With Jay-Z & Molly Crabapple
Watch this video from the Drug Policy Alliance titled, “What is the Drug War? With Jay-Z & Molly Crabapple.” In the video, they discuss the War on Drugs and the push to participate in the underground economy when marginalized racial-ethnic minority communities are largely excluded from the mainstream economy.
Race-Ethnicity and Illicit Drug, Alcohol, and Tobacco Use
The disproportionate rates of incarceration for Blacks and Latinos convicted of drug-related crimes in the U.S. could lead people to believe these racial-ethnic groups use drugs at significantly higher rates than other racial-ethnic groups. This, however, is not the case.
In 2017, adolescent alcohol and illicit drug use disparities were observed for a number of racial-ethnic groups.
Asian American adolescents aged 12-17 years reported the lowest rate (7.4%) of using alcohol or illicit drugs within the past 30 days among racial-ethnic groups by a significant margin. Rates for adolescents in other racial-ethnic groups from highest to lowest were:
- 16.3% among adolescents who identify with two or more races (more than twice the lowest group rate);
- 15.5% among non-Hispanic White adolescents (more than twice the lowest group rate);
- 14.4% among American Indian or Alaska Native adolescents (94.6% higher than the lowest group rate);
- 12.2% among Hispanic or Latino adolescents (64.9% higher than the lowest group rate);
- 11.9% among non-Hispanic Black adolescents (60.8% higher than the lowest group rate); and
- 11.9% among Native Hawaiian or Other Pacific Islander adolescents (60.8% higher than the lowest group rate) (Office of Disease Prevention and Health Promotion, Alcohol or Illicit Drug Use Among Adolescents, 2017; Center for Behavioral Health Statistics and Quality, 2017 National Survey on Drug Use and Health, 2018).
Review the below Chart 3.5 to see a timeline of disparities in illicit drug use each month by race-ethnic minorities aged 12 or older between 2002 and 2013. The chart demonstrates that the trend in illicit drug use is higher for Black or African Americans than White counterparts, in contrast to the data from adolescents above, and that Asian Americans still tend to be the lowest users of illicit drugs in America when considering race-ethnicity. However, note that the chart below does not account for persons of two or more races (due to a small sample size), which were the highest users of illicit drugs and alcohol in adolescents above. Also note that the chart below does not consider alcohol use, but only illicit drug use.
Chart 3.5 – Past Month Illicit Drug Use among Persons Aged 12 or Older by Race-Ethnicity in between 2002 and 2013
Moderate Drinking, Binge Drinking, and Excessive Alcohol Use
Image 3.6 – Liquor Store
As discussed in this section, moderate drinking is defined as 2 drinks or less in a day for men and 1 drink or less in a day for women, when alcohol is consumed. Drinking less is better for healthier than drinking more (Dietary Guidelines for American, 2021). Binge drinking is defined as a pattern of alcohol consumption that brings the blood alcohol concentration (BAC) level to 0.08% or more. This pattern of drinking usually corresponds to 5 or more drinks on a single occasion for men or 4 or more drinks on a single occasion for women, generally within about 2 hours (CDC, Alcohol and public health, n. d.). And excessive alcohol use is defined to include binge drinking, heavy drinking, any alcohol use by people under the age of 21 minimum legal drinking age, and any alcohol use by pregnant women (CDC, Alcohol and public health, n. d.).
Rates of alcohol use, binge drinking and excessive alcohol use within the past month among adults aged 21 and older show disparities across multiple racial-ethnic groups.
Whites (60.5%) and those who identify as two or more races (60.5%) use alcohol at rates that outpace other racial-ethnic groups. Rates of alcohol use by Hispanics or Latinos (49.1%), Blacks or African Americans (48.6%), and Native Hawaiians or Other Pacific Islanders (48.7%) are followed by Asian Americans (41.4%) and American Indians or Alaska Natives (35.3%).
Rates of binge drinking alcohol in the past month were lowest among Asian adults (14.4%) by a significant margin. Rates of binge drinking in the past month reported by other racial-ethnic groups were:
- 31.2% among adults who identify with two or more races (more than twice the lowest group rate);
- 27.9% among Hispanic or Latino adults (93.8% higher than the lowest group rate);
- 26.5% among White adults (84.0% higher than the lowest group rate);
- 25.8% among Black or African American adults (79.2% higher than the lowest group rate);
- 22.7% among American Indian or Alaska Native adults (57.6% higher than the lowest group rate); and
- 22.7% among Native Hawaiian or Other Pacific Islander adults (57.6% higher than the lowest group rate).
Rates of excessive alcohol use within the past month were also lowest among Asian American adults (2.6%) at rates significantly lower than that of other racial-ethnic groups, which ranged from 61.5% higher to over 4 times higher. Rates of excessive alcohol use within the past month for other racial-ethnic groups were:
- 11.3% among adults who identify with two or more races (more than 4 times the lowest group rate);
- 7.4% among White adults (nearly 3 times the lowest group rate);
- 5.5% among American Indian or Alaska Native adults (more than twice the lowest group rate);
- 5.1% among Hispanic or Latino adults (nearly twice the lowest group rate);
- 4.7% among Native Hawaiian or Other Pacific Islander adults (80.8% higher than the lowest group rate); and
- 4.2% among Black or African American adults (61.5% higher than the lowest group rate) (Center for Behavioral Health Statistics and Quality, 2020).
Tobacco Use
Rates of tobacco product use within the past month for persons aged 12 or older were lowest among Asian Americans (9.4%), whose rates of use were more than 3 times lower than racial-ethnic groups with the highest rates of use (31.3% American Indians or Alaska Natives; 29.0% two or more races ethnicities), and more than 2 times lower than Blacks or African Americans (23.5%), Whites (23.3%), and Native Hawaiians or Other Pacific Islanders (19.2%). At 1.5 times the lowest rates, Hispanics or Latinos reported the second lowest rates of current tobacco product use at 14.4% (Center for Behavioral Health Statistics and Quality, 2020).
Critical Thinking
Do the incarceration disparities for drug crimes among racial-ethnic minority groups match the patterns of illicit drug use across racial ethnicities? Discuss similarities and differences.
The Underground Economy: A Survival Strategy for the Urban Poor
Image 3.7 – Street Vendor Selling Found Objects
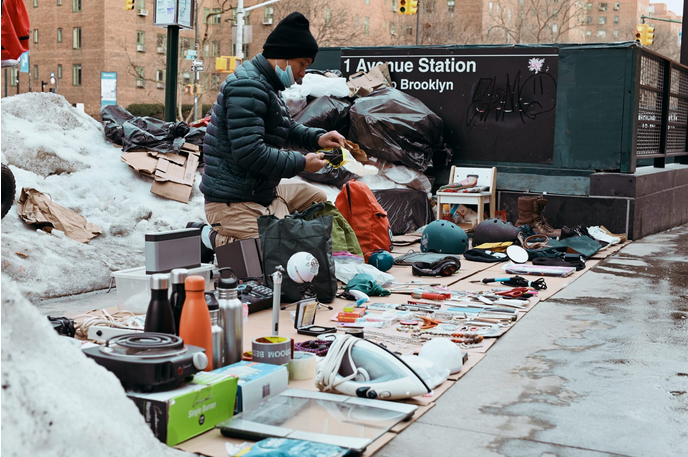
What is an underground economy? And why would individuals and communities participate in one?
Venkatesh (2006) defines underground economies as “a widespread set of activities, usually scattered and not well integrated, through which people earn money that is not reported to the government and that, in some cases, may entail criminal behavior. In other words, the unreported income can derive from licit exchange, such as selling homemade food or mowing a neighbor’s lawn, and illicit practices, such as advertising sexual favors or selling secondhand guns without a permit [or selling illicit drugs].” These underground exchanges are governed by rules, or codes, to be followed and enforced, with likely consequences of actions.
For the majority of Americans, the existence of an underground economy in the U.S. may seem far-fetched. Further, it may seem unnecessary, even treasonous. But for many people living in concentrated poverty, the underground economy is a lifeline to grab when individuals, families and entire communities are in a social and economic freefall beyond the grasp of the mainstream social structures serving middle-class America.
Watch this video and listen to Ta Nehisi-Coates read a moving passage from his book, “Between the World And Me.”
Neshisi-Coates grew up in the inner city of Baltimore, Maryland. He wrote, ”Between the World And Me,” a National Book Award Winner (2015) and New York Times bestseller, as a letter to his 15 year old son about growing up Black in America.
Video 3.3 – Ta-Nehisi Coates Reads from “Between the World and Me”
When education systems in poor communities are lacking (largely due to policies designed to fund neighborhood schools through local property tax revenue); where much of the buildings and housing stock are either in disrepair or located in areas with high crime and/or unhealthy levels of environmental pollution driving down their value (and subsequently their tax-generating capacity and their ability to produce adequate funding streams to support strong schools); when education infrastructure and poor neighborhoods are impaired in these ways, full-time and living-wage employment becomes difficult to obtain for individuals living in communities with decades of economic disinvestment. With health insurance tied to full-time employment in the U.S., many people born into and living in poverty do not have access to mainstream healthcare, relying instead upon government programs such as Medicaid and CHIP (Children Health Insurance Program), or no healthcare at all. Recent data from 2020-2021 show, over 81 million people were enrolled in either Medicaid or CHIP (Centers for Medicare and Medicaid Services, 2021) along with 30 million people who were uninsured (U. S. Department of Health and Human Services, 2021), totaling 111 million people, or over ⅓ of the U.S. population (33.5%) either on government-sponsored healthcare, or uninsured. Further, consider the impacts of home lending practices, termed “redlining,” initiated by the Federal Housing Administration in the 1930s that actively segregated housing in cities and towns across the country by refusing to insure mortgages for properties located within and around African-American neighborhoods while denying mortgages altogether for people of color in predominantly white, middle-class communities (Rothstein, 2017).
Intersect these systemic socioeconomic factors with the stark incarceration disparities for drug crimes across racial-ethnic groups and one can begin to understand why an underground economy exists.
Listen as Sudhir Venkatesh, William B. Ransford Professor of Sociology & African-American Studies at Columbia University in New York, speaks with Harvard University Press about his book, “Off The Books: The Underground Economy of the Urban Poor.”
Having lived and worked for 10 years in Chicago’s South Side, the community highlighted in this book, while completing graduate studies in sociology at University of Chicago, Off the Books is a true account of the intersectional complexities and inner workings of a modern day underground economy in an impoverished inner city neighborhood.
Audio File 3.1 – Sudhir Venkatesh, William B. Ransford Professor of Sociology & African-American Studies at Columbia University in New York, speaks with Harvard University Press about his book, “Off The Books: The Underground Economy of the Urban Poor”
Marlene Matteson was the person least likely to mourn the death of Johnnie “Big Cat” Williams, leader of the Maquis Park Kings, the local neighborhood gang. Marlene knew firsthand the destruction that gang activity could bring upon families. A mother of three, she was also a widower as a result of the gangland slaying of her own husband. “My husband died like [Big Cat] did,” she said, noting the similarities of Billy Matteson’s murder in 1992 and Big Cat’s fall on a cold, blustery morning in 2003. “Big Cat never knew what hit him. Just like my Billy. Came up on his back, shot him when he wasn’t looking. Probably didn’t feel nothing.” Both Billy Matteson and Big Cat were slain late at night, in the presence of their bodyguards, who were also injured. The killers were never found. Marlene Matteson accepted the news of Big Cat’s murder with a mixture of relief and apprehension. As the president of the 1700 South Maryland Avenue Block Club, she knew that gang activity created persistent safety problems in her area. She saw in Big Cat’s death a sign of difficult times ahead. Life was going to change, sharply and perhaps for the worse, in Maquis Park. She could no longer call on Big Cat to keep rank-and-file members out of parks in the afternoon, when kids came back from school. She could no longer wake him and demand that he put an end to the late-night carousing of younger gang members on her block. With little help from law enforcement, she wondered who would help her police the gang members who overtook public spaces with abandon and whose rhythms and inner clocks did not match those of the residents, like Marlene, who woke each morning to go to work or take children to school.
On that December 2003 morning, a week after Big Cat’s death, Marlene Matteson sat with her thoughts and with a dozen other residents of the community in the back room of the Maquis Park Prayer and Revival Center, a small storefront church on Indiana Avenue in Chicago’s historic Southside black community. She was not the only person in the room struggling to make sense of Big Cat’s death. The others in attendance were unlikely to express great sadness for a gang leader who peddled drugs and brought violence and instability to the neighborhood; but they, too, were touched by sadness, anger, and an uncertainty about what lay ahead.
“You know they’re going to be after each other now,” said Jeremiah Wilkins, a local pastor, referring to the inevitable internecine battles among local gang members to fill Big Cat’s void. “No one knows yet who’s taking [Big Cat’s] place.”
“Yeah, well, it ain’t gonna be pretty, but we been there before,” said Ola Sanders, the proprietor of Ola’s Hair Salon on 16th Street. “Someone’s going to be the leader, but it don’t matter who. We got to stay together. That’s what’s really important, okay?” “Look, whatever these brothers do, we can’t stop them,” chimed in James Arleander, a local handyman who for twenty years had been repairing cars off the books for local residents in the parking lot behind the church. “Let’s not pretend we’re sad or nothing. I mean the man was a killer! You all are acting like he’s your friend. Don’t make any sense to sit here crying. Man was a killer.” James’s voice trailed off. “I agree,” said Dr. J. T. Watkins, director of Paths Ahead, a small social service center that ran programs for Maquis Park’s youth. “Look, we got to go ahead. We all know why we’re here. I mean no offense, Pastor. We’re mourning, but we got to make our money. Do you all agree? Well, am I right or not?”
There was silence. The room was still except for Pastor Wilkins’s finger tapping the wooden table in time with the clock on the wall. For nearly five minutes, no one responded to Dr. Watkins’s question, in part because no one could justifiably dispute his contention—money was the chief reason for the group’s convening that morning. The livelihood of these community leaders was at stake. Yes, they were all concerned about the escalation in violence that was certain to result with Big Cat’s passing: other local gangs would be battling to control the Kings’ drug-trafficking territories in the neighborhood. They were all aware of the chaos that could come as a new hierarchy was chosen. But Big Cat’s death placed in sharp relief their own reliance on dangerous and illegal ways of making ends meet. They were forced to confront their own deep involvement in an outlaw economy.
Although some found it difficult to admit, everyone in the room that morning had benefited materially from Big Cat’s presence. Their motive could have been personal financial gain, political power, or a desire to do their own work more effectively, whether that be preaching or changing a tire. Big Cat not only helped Marlene to police younger gang members; he also gave money to her block club for kids’ parties, and members of his gang patrolled the neighborhood late at night because police presence was a rarity. Dr. Watkins and Pastor Wilkins would need to find a new source of philanthropy, now that Big Cat’s monthly donations to their respective organizations had ended. Big Cat’s gang ensured James Arleander a near monopoly on local off-the-books books car repair by intimidating other mechanics who tried to cut into James’s business. Ola probably would not receive $500 each weekend for letting the gang turn her salon into a thriving nightclub-the weekly “Maquis Park Dee-Jay” contest had been one of Big Cat’s favorite social activities. And others in the room that morning were no different: some received money from Big Cat, others benefited from the customers he sent their way-for everything from homemade meals to fake social security cards-and and still others were hoping to use Big Cat’s influence over two thousand young men and women to win electoral office or organize downtown protests. All of them allowed Big Cat’s gang to operate fluidly, whether that meant tolerating drug selling, presiding over funerals of deceased gang members, participating in citywide gang basketball tournaments, or “cleaning” the gang’s profits through their own businesses…
… Big Cat’s prominent position was the visible tip of the iceberg that is Maquis Park’s shadow economy. He represented a very small part of the innumerable financial exchanges that are not reported ported to the government. From off-the-books day care and domestic work to pimping and prostitution, unreported earnings wove together the social fabric in Maquis Park and surrounding poor neighborhoods. Big Cat was just one of many traders, brokers, hustlers, hawkers, and, of course, customers, who moved about in the streets, homes, and alleyways selling inexpensive labor and goods-or searching for them. He was certainly one of its most famous-and infamous-but he was just one of many who performed functions most Americans associate with the mainstream economy and the government agencies that regulate legitimate exchange. He was only one of many local stakeholders holders who resolved economic disputes because the state had no formal authority. Many other local people enforced contracts, or resolved disputes, or, for a fee, could find you a gun, a social security card, or even a job as a day laborer or a nanny for a wealthy family. Others may have claimed control over parks, alleyways, and street corners; these people would have to be paid if one wanted to fix a car, sell drugs, or panhandle at that spot. And there were many local loan sharks, besides Big Cat, who could loan you cash, or who could find you customers-for stolen stereos or drugs, for prostitutes or home-cooked lunches-in a matter of a few hours (Venkatesh, 2006).
Critical Thinking: In Two Parts
I invite you to take a deep breath before you begin this activity. If you can, be still for a moment and recall this true story you have just read. As best you can, bring to mind as vividly as you can the people in the story: what they may have been wearing, what their voices sound like, what was said, what each person may have been feeling. . . . Now, imagine you live in that-inner city neighborhood. Imagine that meeting is happening right now and you are one of the community members sitting in that room.
Part I: Select one of the people in this story, and describe what the experience might be like for that person (identify the individual in your response). You might consider any of the following: What is that person thinking right now? What emotions is that person feeling? Is that person feeling tight and tense in her/his body? Or loose and relaxed? If that person needs assistance of some kind, where might that person go for help? How will that person make up for the future financial losses resulting from the gang leader’s death? What are the risks? What will happen next? What will happen to their loved ones?
Part II: Continue to focus on what the experience might be like for the person you selected for Part I of this activity. Identify and discuss some of the social-ecological community level factors and determinants that may have influenced that person to participate in an “off the books” financial relationship with a known drug dealer and murderer. Also, describe how that person may feel about Johnnie “Big Cat” Williams, the deceased leader of the Maquis Park Kings street gang.
Other Strategies for Responding to Drug Use and Misuse
Ending the “War on Drugs”
There are three videos below. The first two criticize current or past approaches to drug use and misuse strategies. As you watch the videos, consider whether you agree with the main point the speaker is making. Has the “War on Drugs” been a helpful strategy to stop drug use and misuse? Do you think punishing those addicted to drugs is the correct systemic response to drug misuse? Is there another approach that would be more beneficial to those suffering from drug addiction?
Watch a brief TED Talk from drug policy reformist Ethan Nadelmann titled, “Why we need to end the War on Drugs:”
Video 3.4 – Why We Need to End the War on Drugs
Watch this brief TED Talk titled, “Everything You Think You Know About Addiction is Wrong”, to hear Johann Hari introduce a different perspective in understanding drug addiction:
Video 3.5 – Everything You Think You Know about Addiction is Wrong
Decriminalization: The Unique Story of Portugal
In 2001, Portugal was suffering from record-breaking overdose deaths tied to illicit drug use and addiction.
Portugal is the only country that has decriminalized all drugs. Instead, in Portugal, the country put healthcare and treatment first, rather than criminalization and punishment.
Watch this informational video from Drug Policy Alliance titled, “Decriminalization of Drug Use Explained–Descriminalizacao: A Portuguese Experiment With American Lessons:”
Video 3.6 – Decriminalization of Drug Use Explained–Descriminalizacao: A Portuguese Experiment with American Lessons
Critical Thinking
Has this policy in Portugal (treating the drug issue as a healthcare concern rather than a criminal one) been beneficial in that country? Should other countries, such as the United States, consider implementing this policy? How would this impact the racial-ethnic impact of the “War on Drugs?” Do you think a policy like this would be welcomed in the United States? Why or why not?
Supplemental Materials
Videos
- Democracy Now. (2015, July 22). “Between the World And Me:” Ta-Nehisi Coates Extended Interview on Being Black in America [Video]. https://www.democracynow.org/2015/7/22/between_the_world_and_me_ta
- Families Against Mandatory Minimums [FAMM Video]. Repeal, don’t celebrate, the Anti-Drug Abuse Act of 1986 [Video]. YouTube. https://youtu.be/BhAVJFuPJRc
- Mauer, M., & King, R. S. (2007). A 25-year quagmire: The war on drugs and its impact on American society. The Sentencing Project. https://www.sentencingproject.org/publications/a-25-year-quagmire-the-war-on-drugs-and-its-impact-on-american-society/
- Moyers, B. [Moyers & Company]. (2013, December 20). Michelle Alexander: Locked Out of the American Dream. [Video]. YouTube. https://youtu.be/om2hx6Xm2JE
- TEDx Talks. (2013, October 16). The future of race in America. Michelle Alexander at TEDxColumbus. [Video.] YouTube. https://youtu.be/SQ6H-Mz6hgw
- Tylek, B. (2021, May 24). The multibillion-dollar US prison industry–and how to dismantle it [Video]. TED. https://www.ted.com/talks/bianca_tylek_the_multibillion_dollar_us_prison_industry_and_how_to_dismantle_it?language=en
Interactive Online Applications
- University of Richmond’s Digital Scholarship Lab. (n.d.). Mapping Inequality [Interactive map]. https://dsl.richmond.edu/panorama/redlining/
Books
- Alexander, M. (2010). The new Jim Crow: Mass incarceration in the age of colorblindness. The New Press.
- Venkatesh, S. A. (2008). Gang leader for a day: A rogue sociologist takes to the streets. Penguin.
- Venkatesh, S. A. (2006). Off the books: The underground economy of the urban poor. Harvard University Press.
References
Alexander, M. (2010). The new Jim Crow: Mass incarceration in the age of colorblindness. The New Press.
anarchosyn. (2007, May 27). RISK AWR WC T7L LosAngeles Graffiti Art [Digital image]. Flickr. https://www.flickr.com/photos/24293932@N00/530211480
American Civil Liberties Union. (n.d.). Stories of ACLU clients swept up in the Hearne drug bust of November 2000. www.aclu.org/DrugPolicy/DrugPolicy.cfm?ID=11160&c=80
American Psychological Association. (2017, July). Ethnic and racial minorities & socioeconomic status [Factsheet]. https://www.apa.org/pi/ses/resources/publications/factsheet-erm.pdf
Block, M. & Twist, S. (1994). The Report Card on Crime and Punishment. ALEC Foundation. https://www.ojp.gov/ncjrs/virtual-library-abstracts-report-card-crime-and-punishment
Braveman, P.A. (2003). Monitoring equity in health and healthcare: A conceptual framework. Journal of Health, Population, and Nutrition, 21(3): 181-92. https://pubmed.ncbi.nlm.nih.gov/14717564/
Braveman, P. & Gruskin, S. (2003). Defining equity in health. Journal of Epidemiology and Community Health, 57(4): 254-258. https://dx.doi.org/10.1136/jech.57.4.254
Carson, E. A. (2018). Prisoners in 2016. U.S. Department of Justice, Bureau of Justice Statistics. https://www.bjs.gov/content/pub/pdf/p16.pdf
Center for Behavioral Health Statistics and Quality. (2020). Results from the 2019. National Survey on Drug Use and Health: Detailed tables. Substance Abuse and Mental Health Services Administration. https://www.samhsa.gov/data/report/2019-nsduh-detailed-tables
Centers for Medicare and Medicaid Services. (2021 March). Medicaid & CHIP Enrollment Data Highlights. https://www.medicaid.gov/medicaid/program-information/medicaid-and-chip-enrollment-data/report-highlights/index.html
Commission on Social Determinants of Health. (2008). Closing the gap in a generation: Health equity through action on the social determinants of health. Final report of the Commission on Social Determinants of Health. World Health Organization: Geneva. https://www.who.int/publications/i/item/WHO-IER-CSDH-08.1
David, S. L., Rao, S. A., & Robertson, E. B. (2003). Preventing drug use among children and adolescents: A research-based guide for parents, educators, and community leaders, in brief (2d ed.) (NIH Publication No. 04-4212(A)). U.S. Department of Health and Human Services, National Institutes of Health, National Institute on Drug Abuse. https://nida.nih.gov/sites/default/files/preventingdruguse_2.pdf
Davis, A. (2007). Arbitrary justice: The power of the American prosecutor. Oxford University Press. https://doi.org/10.1093/acprof:oso/9780195384734.001.0001
Drug Policy Alliance. (2015, June). The Drug War, Mass Incarceration, and Race. https://www.unodc.org/documents/ungass2016/Contributions/Civil/DrugPolicyAlliance/DPA_Fact_Sheet_Drug_War_Mass_Incarceration_and_Race_June2015.pdf
Drug Policy Alliance. (2016, September 15). What is the drug war? With Jay-Z & Molly Crabapple [Video]. YouTube. https://youtu.be/HSozqaVcOU8
Drug Policy Alliance. (2019, February 20). How Portugal solved their drug crisis [Video]. YouTube. https://youtu.be/iKe9R_eiIYA
Finegold K., Conmy A., Chu R. C., Bosworth A., & Sommers, B. D. (2021). Issue brief: trends in the U.S. uninsured population, 2010-2020 (Issue Brief
No. HP-2021-02). Office of the Assistant Secretary for Planning and Evaluation, U.S. Department of Health and Human Services. https://aspe.hhs.gov/sites/default/files/private/pdf/265041/trends-in-the-us-uninsured.pdf
Frontline. (2004, June 17). Four Stories–Erma Faye Stewart and Regina Kelly. The Plea. www.pbs.org/wgbh/pages/frontline/shows/plea/four/stewart.html
Gnadinger, T. (2014, August 22). Health Policy Brief: The Relative contribution of multiple determinants to health outcomes. Health Affairs Blog. https://doi.org/10.1377/forefront.20140822.040952
Hari, J. (2015, June). Everything you think you know about addiction is wrong [Video]. TED. https://www.ted.com/talks/johann_hari_everything_you_think_you_know_about_addiction_is_wrong
Irwin, A. & Solar, O. (2010). A Conceptual Framework for Action on the Social Determinants of Health. World Health Organization. https://www.who.int/sdhconference/resources/ ConceptualframeworkforactiononSDH_eng.pdf
Kirchhoff, S. M. (2010). Economic impacts of prison growth. Library of Congress Congressional Research Service. https://digital.library.unt.edu/ark:/67531/metadc501951/
Nadelmann, E. (2014, October). Why we need to end the war on drugs [Video]. TED. https://www.ted.com/talks/ethan_nadelmann_why_we_need_to_end_the_war_on_drugs
National Center for HIV, Viral Hepatitis, STD, and TB Prevention. (2019). NCHHSTP Social Determinants of Health: Frequently Asked Questions. Centers for Disease Control and Prevention. https://www.cdc.gov/nchhstp/socialdeterminants/faq.html
National Institute on Drug Abuse. (2011, June). Preventing drug use among children and adolescents (in brief). U.S. Department of Health and Human Services, National Institutes of Health. https://nida.nih.gov/publications/preventing-drug-use-among-children-adolescents/chapter-1-risk-factors-protective-factors/what-are-risk-factors
National Inventory of Collateral Consequences of Conviction. (n.d.). What are collateral consequences? https://niccc.nationalreentryresourcecenter.org/
Nixon, R. (1971, June 17). Special Message to the Congress on Drug Abuse Prevention and Control [Transcript]. The American Presidency Project. University of California, Santa Barbara. Retrieved August 7, 2021, from https://www.presidency.ucsb.edu/node/240245
Office of Disease Prevention and Health Promotion. (n.d.). Alcohol or illicit drug use among adolescents, 2017. https://www.healthypeople.gov/2020/leading-health-indicators/2020-lhi-topics/Substance-Abuse/data#SA-13
Pearl, B. (2018, June 27). Ending the war on drugs: By the numbers. Center for American Progress. https://www.americanprogress.org/issues/criminal-justice/reports/2018/06/27/452819/ending-war-drugs-numbers/
Rhodes, T. (2002). The ‘risk environment’: A framework for understanding and reducing drug-related harm. International Journal of Drug Policy, 13(2), 85-94. https://doi.org/10.1016/S0955-3959(02)00007-5
Richard Nixon Foundation. (2016, April 29). President Nixon declares drug abuse “public enemy number one” [Video]. YouTube. https://youtu.be/y8TGLLQlD9M
Rothstein, R. (2017). The color of law: A forgotten history of how our government segregated America. Liveright Publishing
Shannon, R. (2019, May 10). 3 ways the 1994 crime bill continues to hurt communities of color. Center for American Progress. https://www.americanprogress.org/issues/race/news/2019/05/10/469642/3-ways-1994-crime-bill-continues-hurt-communities-color/
Schulenberg, J. E., Johnston, L. D., O’Malley, P. M., Bachman, J. G., Miech, R. A. & Patrick, M. (2020). Monitoring the Future national survey results on drug use, 1975–2019: Volume II, College students and adults ages 19–60. Institute for Social Research, The University of Michigan. http://monitoringthefuture.org/pubs.html#monographs
Statista Research Department. (2021, September 29). Reported violent crime rate in the U.S. 1990-2019. https://www.statista.com/statistics/191219/reported-violent-crime-rate-in-the-usa-since-1990/
Substance Abuse and Mental Health Services Administration. (2014). Results from the 2013 National Survey on Drug Use and Health: Summary of national findings. https://www.samhsa.gov/ data/sites/default/files/NSDUHresultsPDFWHTML2013/Web/NSDUHresults2013.pdf
Substance Abuse and Mental Health Services Administration. (2019). Risk and protective factors [Fact Sheet]. https://www.samhsa.gov/sites/default/files/20190718-samhsa-risk-protective-factors.pdf
Substance Abuse and Mental Health Services Administration. (2020). The national survey on drug use and health: 2019 [Data Release; PowerPoint Slides]. https://www.samhsa.gov/data/sites/default/files/reports/rpt29392/Assistant-Secretary-nsduh2019_presentation/Assistant-Secretary-nsduh2019_presentation.pdf
Teasley, D. (2001, January 24). Crime Control: The Federal Response. Congressional Research Service. https://digital.library.unt.edu/ark:/67531/metacrs1529/
The Atlantic. (2017, August 8). Ta-Nehisi Coates reads from Between the World and Me [Video]. YouTube. https://youtu.be/2Ki2fhQIoSI
The Sentencing Project. (2019). Criminal Justice Facts. https://www.sentencingproject.org/news/new-prison-jail-population-figures-released-u-s-department-justice/
Thomas, Y. F. (2007). The social epidemiology of drug abuse. American Journal of Preventive Medicine, 32(6), S141-S146. https://doi.org/10.1016/j.amepre.2007.03.007
Office of the Assistant Secretary for Planning and Evaluation. (2019). 2019 poverty guidelines. U.S. Department of Health and Human Services. https://aspe.hhs.gov/topics/poverty-economic-mobility/poverty-guidelines/prior-hhs-poverty-guidelines-federal-register-references/2019-poverty-guidelines
U.S. Department of Justice. (1994). Violent crime control and law enforcement act of 1994 [Fact Sheet]. National Criminal Justice Reference Service. https://www.ncjrs.gov/txtfiles/billfs.txt
Venkatesh, S. A. (2009). Off the books: The underground economy of the urban poor. Harvard University Press.
Western, B. & Pettit, B. (2010). Collateral costs: Incarceration’s effect on economic mobility. Pew Charitable Trusts. https://www.pewtrusts.org/~/media/legacy/uploadedfiles/pcs_assets/2010/collateralcosts1pdf.pdf
